

Beyond the Headlines: What NFHS-6 Reveals About the Challenge of Measuring Development
What Gets Measured Gets Managed. But What Happens When What Gets Measured Changes?
Management thinker Peter Drucker famously observed, "What gets measured gets managed." Few examples illustrate this better than India's National Family Health Survey (NFHS). For more than three decades, it has served as the country's most comprehensive source of evidence on health, nutrition, fertility, and family welfare shaping policies, informing investments, and guiding development priorities at both national and state levels.
Launched in 1992-93 by the Ministry of Health and Family Welfare, with the International Institute for Population Sciences (IIPS), Mumbai as the nodal agency, the NFHS has now completed six rounds . The latest round, NFHS-6, covered nearly 6.79 lakh households across 715 districts during 2023-24, making it the largest survey in the series and the first to capture India's post-pandemic health landscape.
One of the reasons the NFHS has remained such an important resource is that it allows us to look beyond individual survey results and understand how India's development story is changing over time. Consistency in measurement has made those comparisons possible. As NFHS-6 introduces changes to what is measured, the discussion naturally shifts from what the data says to how the data itself is being generated and what that means for interpreting progress.
What's Changed: Progress, New Pressures, and Missing Data
The Genuine Gains
The NFHS-6 fact sheets, released by MoHFW on May 29, 2026, document real and substantial progress across several indicators . Institutional deliveries have increased from 88.6% to 90.6%, while child stunting has fallen from 35.5% to 29.3%. Severe wasting has also declined, and full immunisation coverage is now estimated at nearly 93%.
Beyond health outcomes, the survey also reflects wider social changes. The share of women who have ever used the internet has almost doubled, while India's Total Fertility Rate has fallen to 1.9, reinforcing a demographic transition that has been unfolding over the last decade.
While these improvements cannot be attributed to a single intervention, they point towards the cumulative effect of sustained investments in programmes such as POSHAN Abhiyaan, Janani Suraksha Yojana, the Universal Immunisation Programme, and Ayushman Bharat.
The Emerging Challenges
Set against these gains are several concerning trends that NFHS-6 brings into focus. C-section delivery rates rose sharply to 27.2% nationally and to 54.1% in private facilities. This far exceeds the WHO's recommended optimal threshold of 10-15%. In urban areas, the rate stands at a striking 40% .
At the same time, obesity is increasing rapidly among adults, with the proportion of overweight or obese women rising from 24% to 30.7%, and high blood sugar among men increasing from 15.6% to 20.9% .
These trends are visible in the data. The more difficult question is what the data cannot now tell us because some of it is no longer being collected.

Why Indicator Continuity Matters: The Case of the Missing Numbers
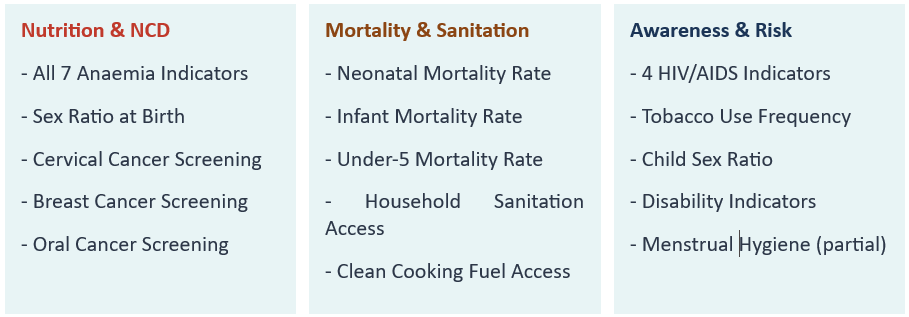
NFHS-6's preliminary fact sheet contains 101 indicators compared to 131 in NFHS-5. The change was not incidental. The survey dropped 43 indicators while adding 13 new ones, representing a net reduction of 30 data points from one of India's most relied-upon surveys.
The omissions span several domains:
Anaemia All seven anaemia indicators were dropped. This is the most consequential omission. NFHS-5 had found that 67% of children under five and 57% of women aged 15-49 were anaemic figures that raised sharp questions about the effectiveness of the government's Anaemia Mukt Bharat programme, launched in 2018 . NFHS-6 continues to track IFA supplement consumption among pregnant women (the programme input), but no longer measures anaemia prevalence (the health outcome). Measuring whether prescriptions were written, while declining to check whether patients recovered, is an incomplete accountability framework.
Child Mortality Neonatal, infant, and under-five mortality rates have been removed from the NFHS fact sheet, redirected to the Sample Registration System (SRS) . While SRS provides national and state-level estimates, NFHS uniquely enabled district-level and socio-economic disaggregation precisely the granularity needed to identify which children, in which regions and income groups, are being left behind.
Sanitation and Clean Cooking Fuel Indicators linked to the Swachh Bharat Mission and Pradhan Mantri Ujjwala Yojana were also dropped. NFHS-5 had shown that only 43.2% of rural households had access to clean cooking fuel data that had prompted difficult questions about Ujjwala Yojana's reach. Both indicators are now absent from the NFHS fact sheet.
Cancer Screening and HIV Awareness Four indicators measuring cancer screening (cervical, breast, oral) introduced for the first time in NFHS-5 have been dropped after a single round. Four HIV/AIDS awareness and prevention indicators have also been removed.
The government's explanation for the anaemia omission centres on methodology: the capillary finger-prick blood sampling method used in previous NFHS rounds, officials have said, may have overstated anaemia prevalence. Haemoglobin testing will now be conducted through the ICMR Diet and Biomarkers Survey (DABS), which uses venous blood considered a more accurate method . This is a defensible scientific position. The implementation concern, however, is that the DABS data has not yet been released, leaving a gap in national anaemia tracking at the precise moment the Anaemia Mukt Bharat strategy most needs an outcome measure.
Lessons for Evaluators
For evaluators and researchers, NFHS-6 offers an important reminder about the relationship between data and interpretation. Too often, development discussions focus on numbers while paying less attention to how those numbers are generated. Yet methodology matters. Definitions matter. Sampling approaches matter. Measurement tools matter. As indicators evolve, evaluators need to move beyond simple trend comparisons and pay closer attention to methodological context.
This requires asking questions such as:
• Are indicators directly comparable across survey rounds?
• Have definitions or measurement approaches changed?
• What assumptions underpin the data?
• How might methodological shifts influence interpretation?
Evidence-based decision-making depends not only on data quality but also on data literacy. Understanding how indicators are constructed is just as important as understanding the results they produce.
Lessons for Policymakers
For policymakers, the discussion around NFHS-6 highlights the importance of balancing innovation with continuity. Development priorities evolve, and measurement systems must evolve with them. New indicators can provide valuable insights into emerging challenges and help strengthen programme design. At the same time, continuity remains essential for tracking progress over time.
One possible approach is to maintain a stable core set of indicators while gradually introducing new dimensions of measurement. This allows policymakers to preserve long-term trend analysis while also responding to changing realities.
Equally important is transparency. Clear documentation of methodological changes helps users interpret findings accurately and reduces the risk of miscommunication.
In an era where data increasingly shapes public discourse, trust in evidence depends as much on transparency as it does on methodology.
Final Reflections: What Measurement Tells Us About Priorities
NFHS-6 is, by every measure, a significant and methodologically robust survey. It documents genuine progress in several areas of public health while also drawing attention to emerging challenges. At the same time, the changes in its indicator framework remind us that surveys are more than statistical exercises they also reflect the priorities a country chooses to measure and monitor.
For evaluators, policymakers, and development practitioners, the broader lesson extends beyond NFHS itself. Credible evidence depends not only on collecting high-quality data but also on maintaining transparency, methodological consistency, and clarity about what is measured and what is not.
The epigraph of this blog comes from Peter Drucker. But there is a second half to that principle that is worth remembering: what gets measured gets managed and what stops being measured risks being forgotten, precisely when it matters most.
At DevInsights, our work in impact assessments, M&E system design, and CSR advisory has consistently shown us that the quality of evaluation depends as much on what is measured as on how it is measured. NFHS-6 is a national-level illustration of a challenge that programme evaluators face at every scale: what happens when the measuring changes, and the data we relied on to track progress is no longer available?
The answer is not to abandon evidence-based planning. It is to design evaluation frameworks that are explicit about indicator choice, transparent about methodology, and honest about the gaps. When data disappears, so does accountability. That is the lesson NFHS-6 leaves us with, and it applies as much to a rural livelihood programme as it does to a national health survey.